Loading

Household Income (Annual)
Sources:
Loading
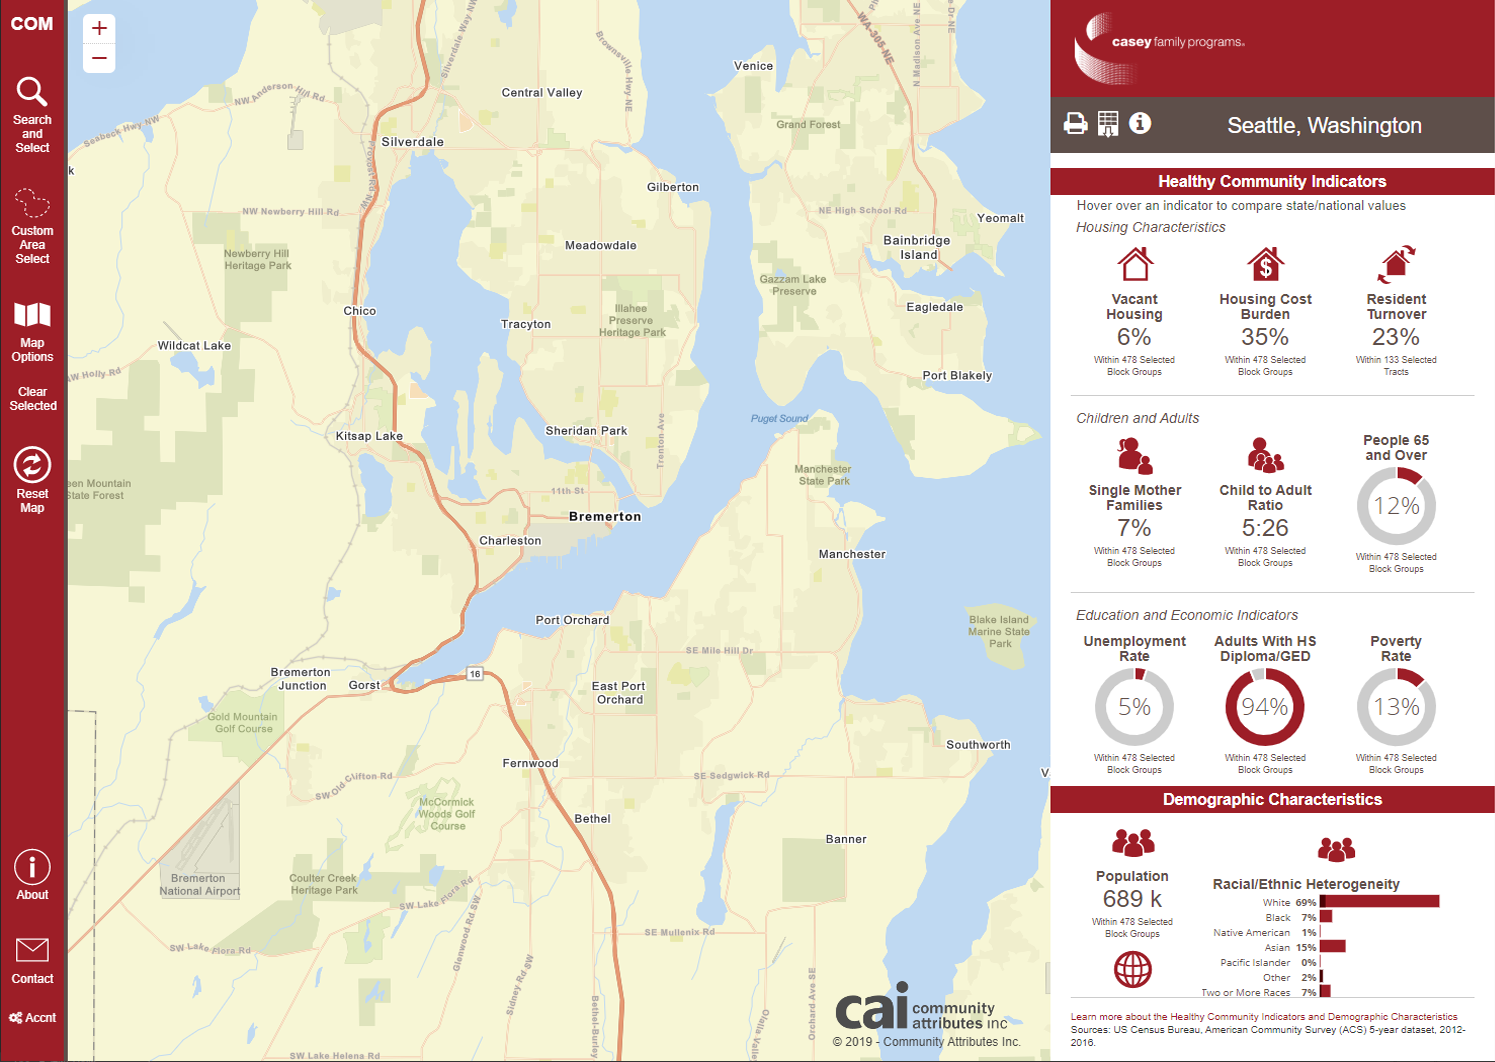
We customize our platform to display a wide range of demographic and socio-economic data. Content areas include:
- Workforce & education
- Housing
- Civic & cultural health
- Economic development
- Commercial real estate
We also integrate open or proprietary data through APIs or spreadsheets.
Learn More
Send us a message today if you'd like to learn more about customizing your data view on CAI Live.
Message submitted successfully.
Send Another Message
Loading
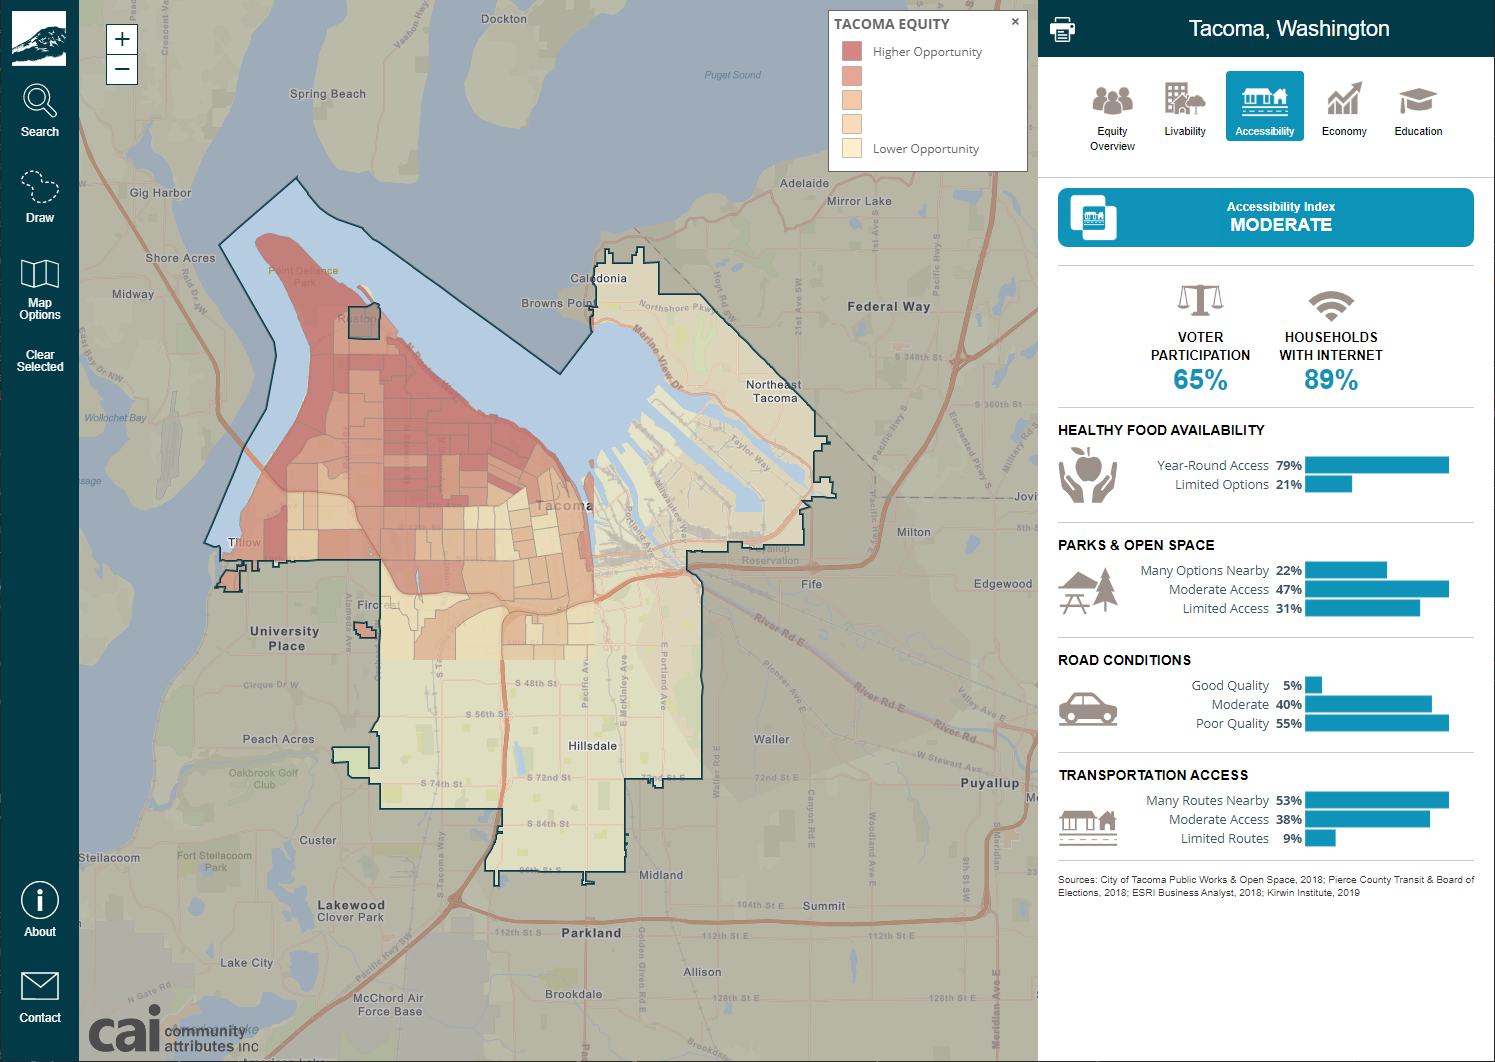
The advanced features in our premium platform offer tools for in-depth data discovery. These tools are optimal for documenting and sharing findings.
- Customizable data panels
- Parcel & land use editing
- Designated user access
- Quick development time
- Downloadable PDF's & excel reports
- Customizable map layers
- Customizable geographic boundaries
- Visual updates to match your branding
- And more!
Learn More
Are you also interested in learning about customizing your data view?
Message submitted successfully.
Send Another Message
 Loading...